NZHawke's Bay
Napier Tides
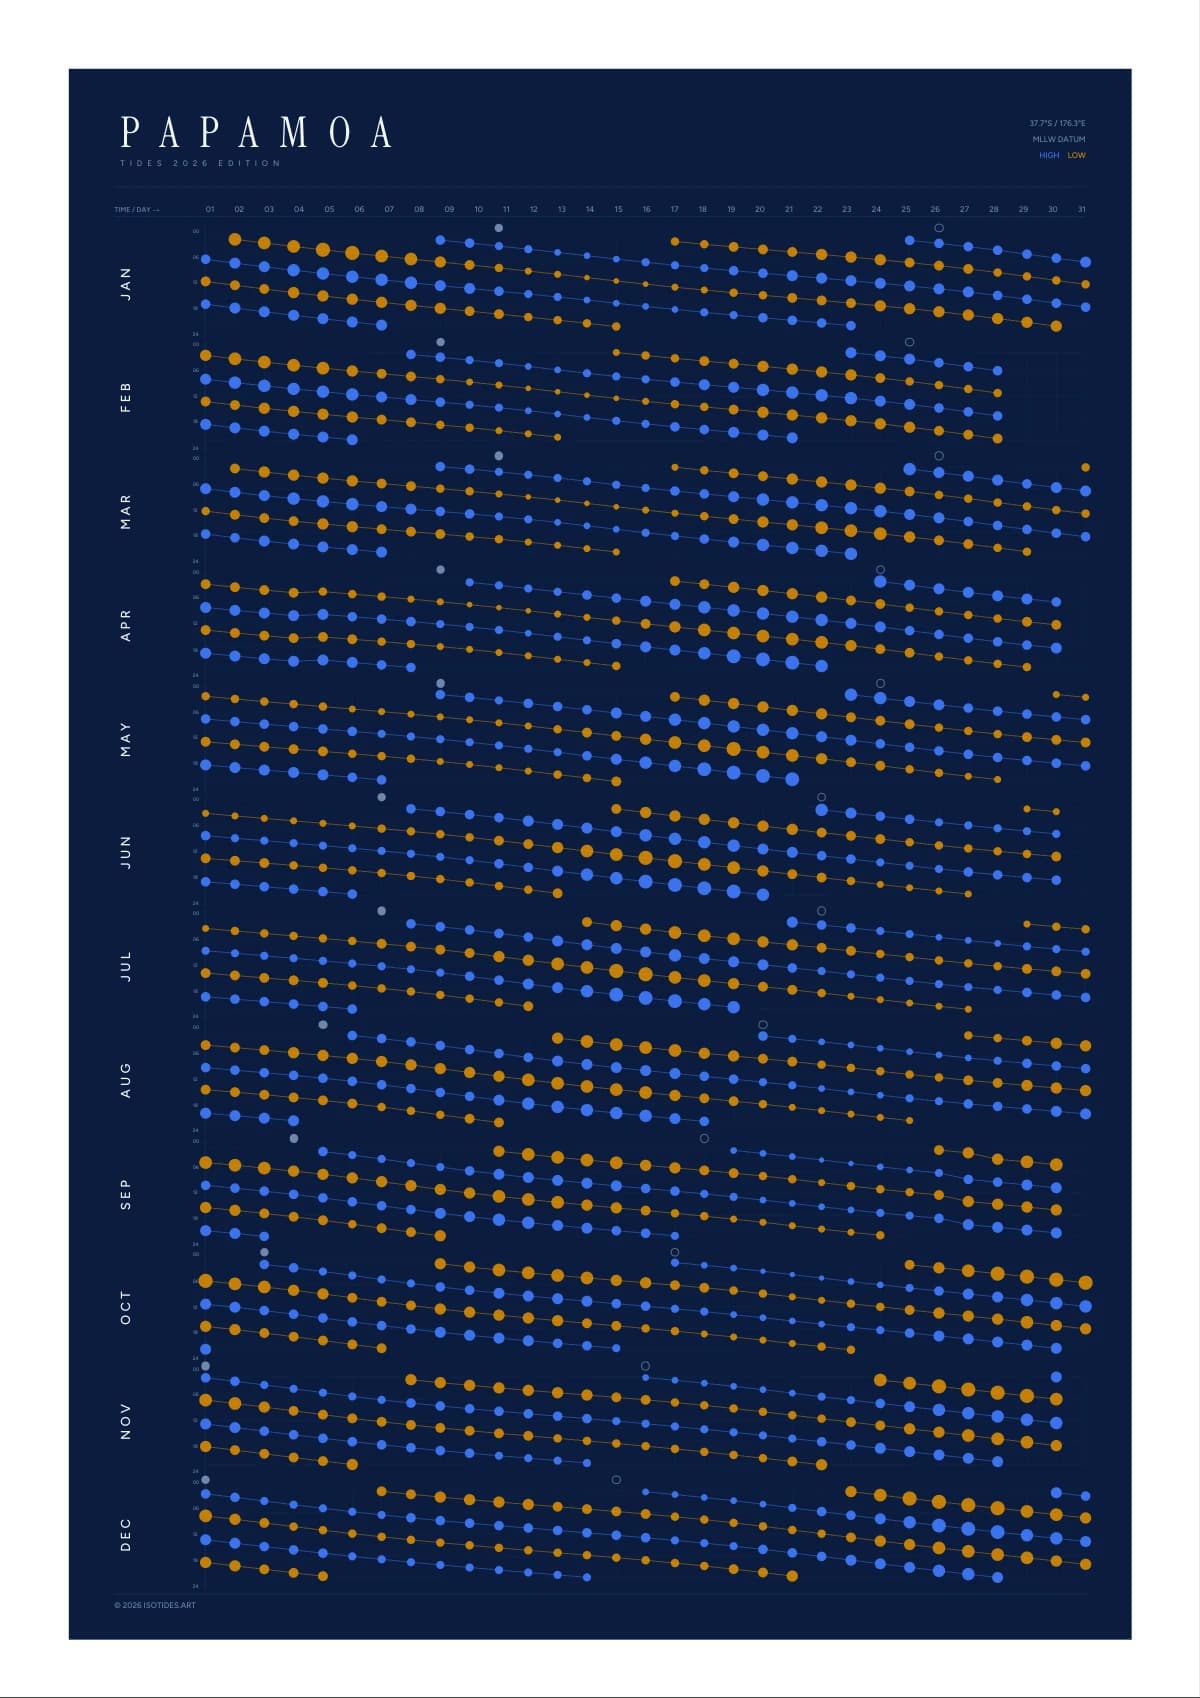
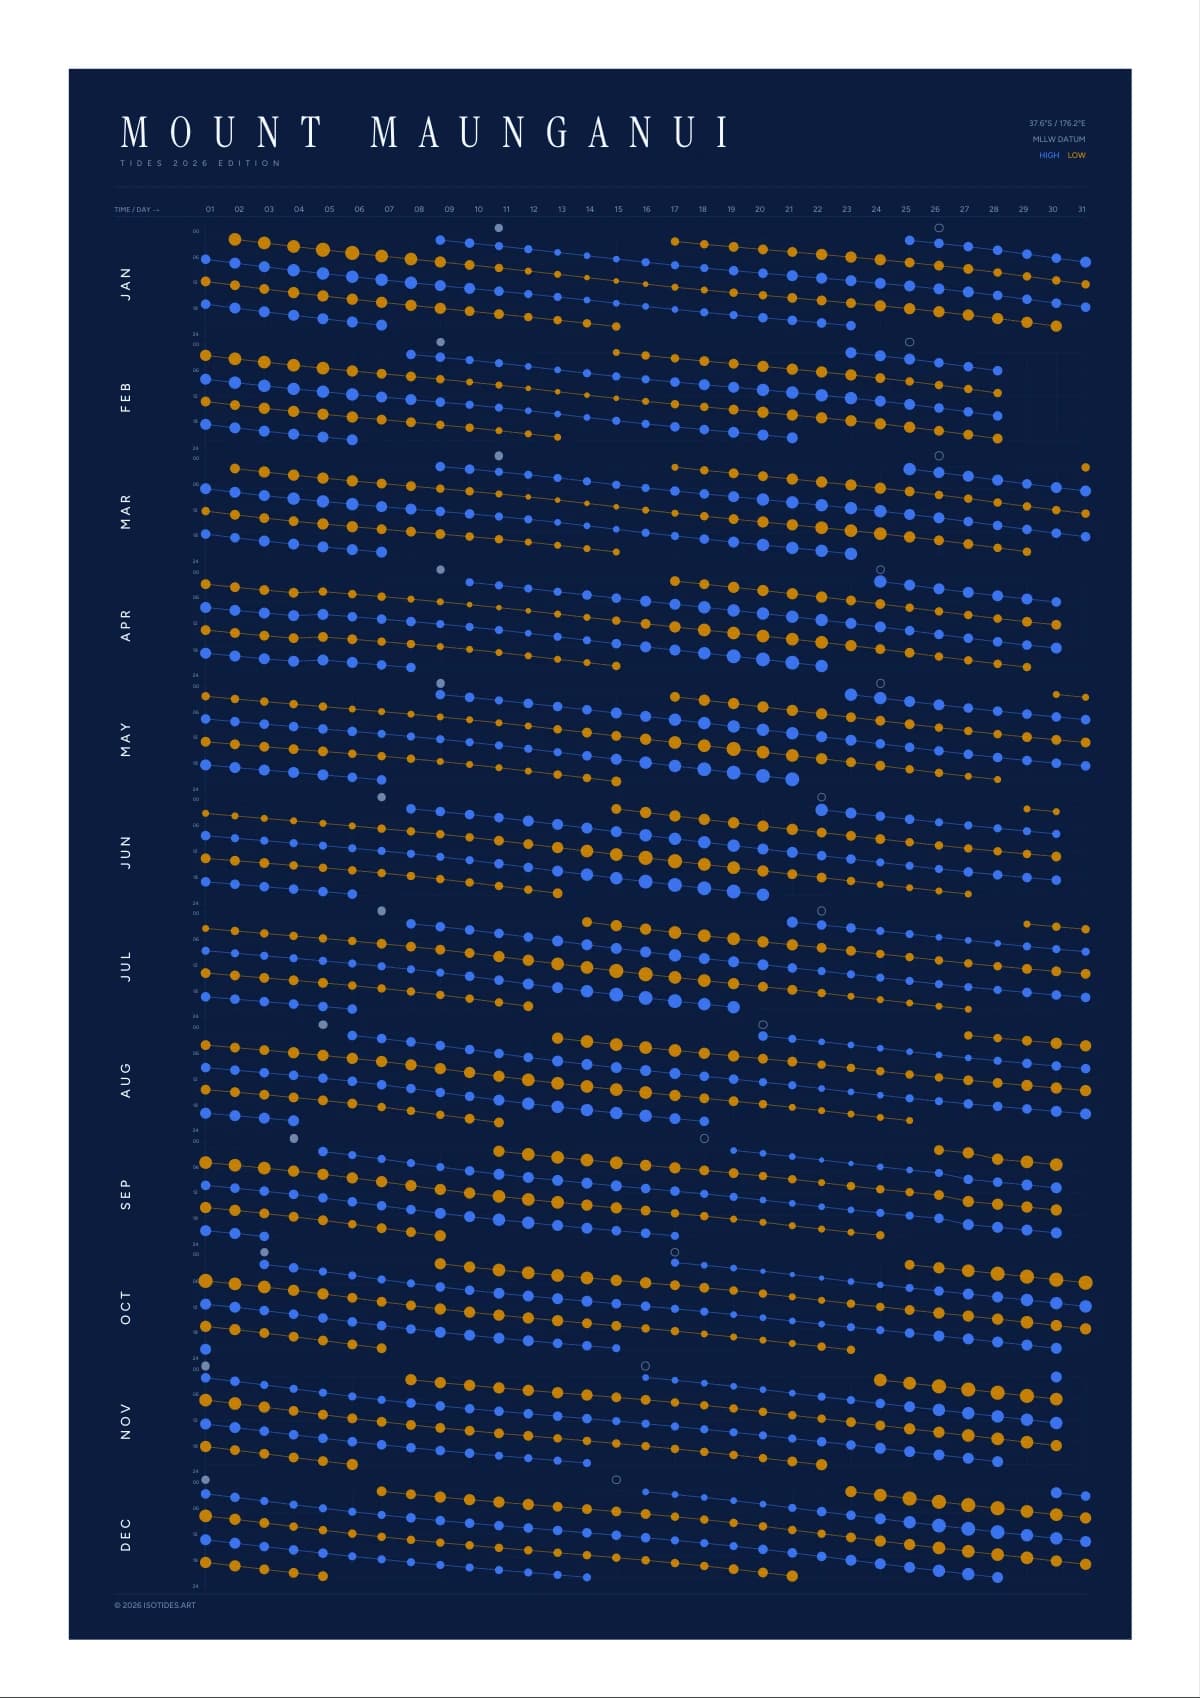
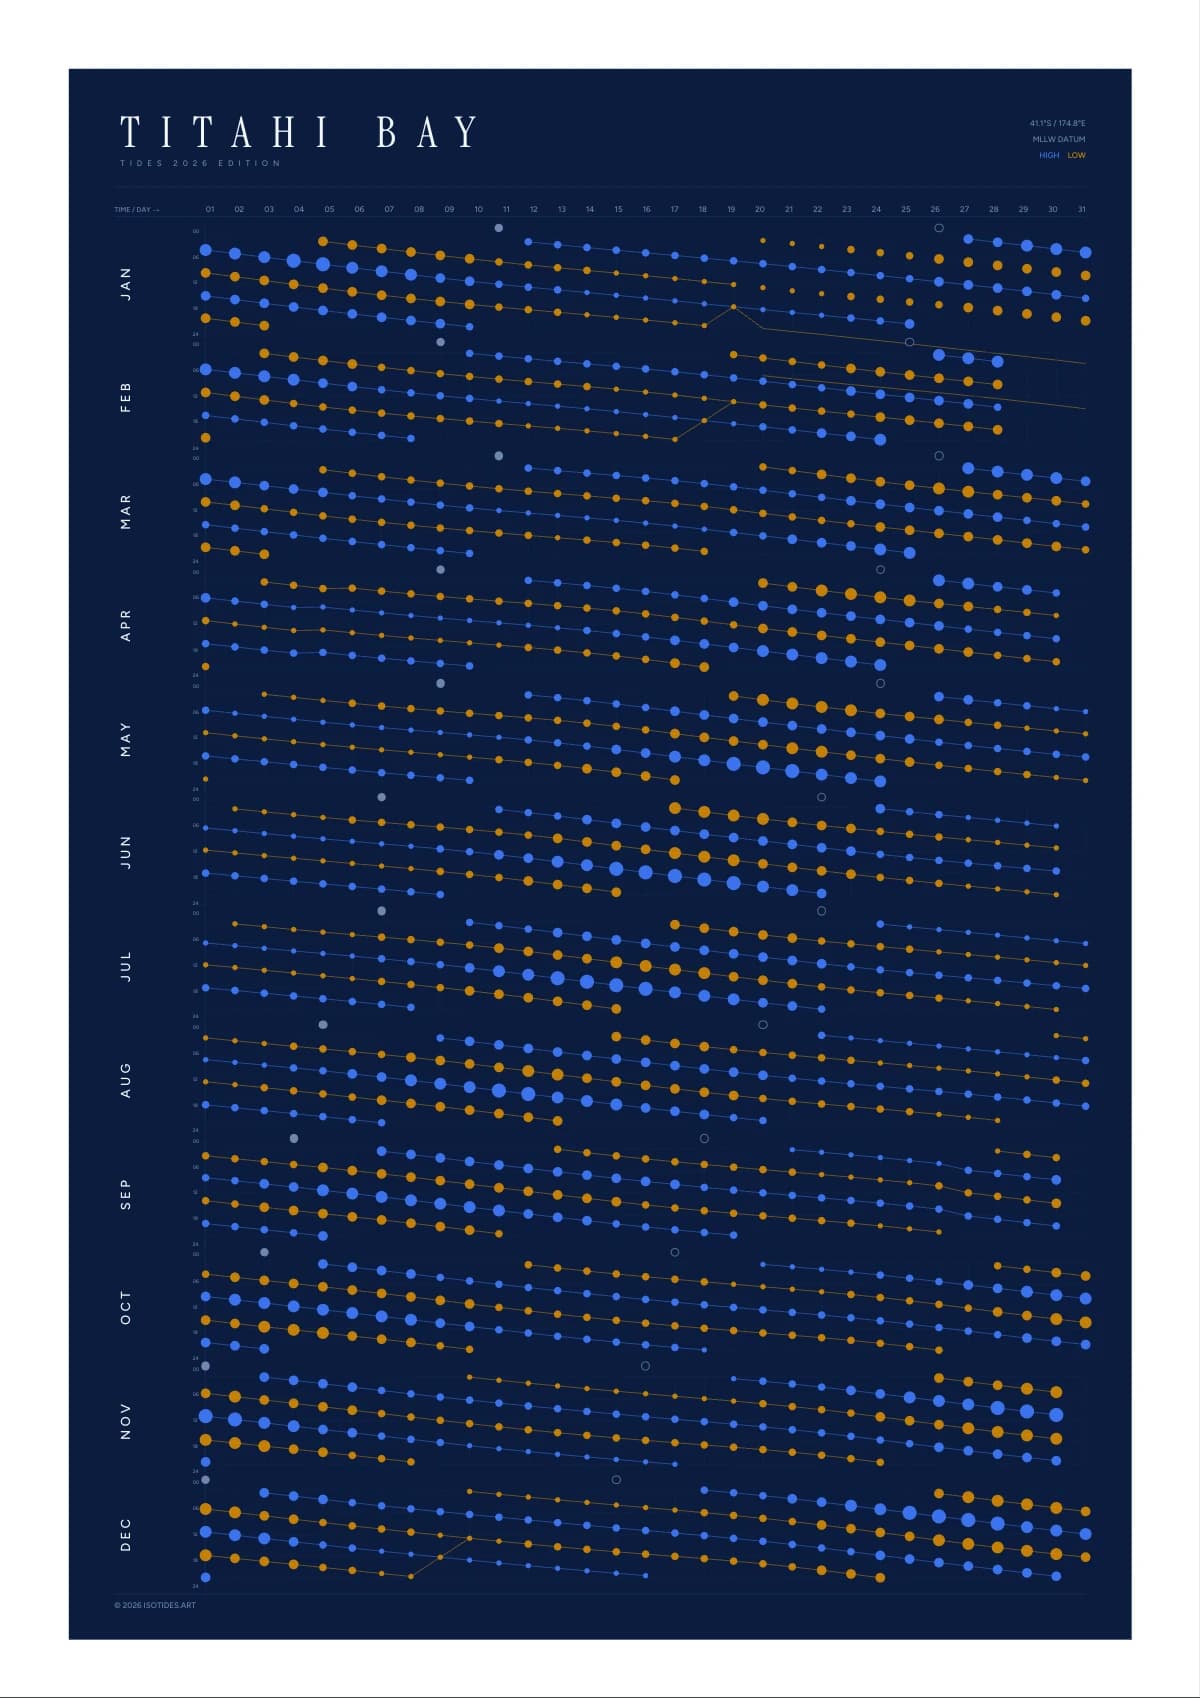
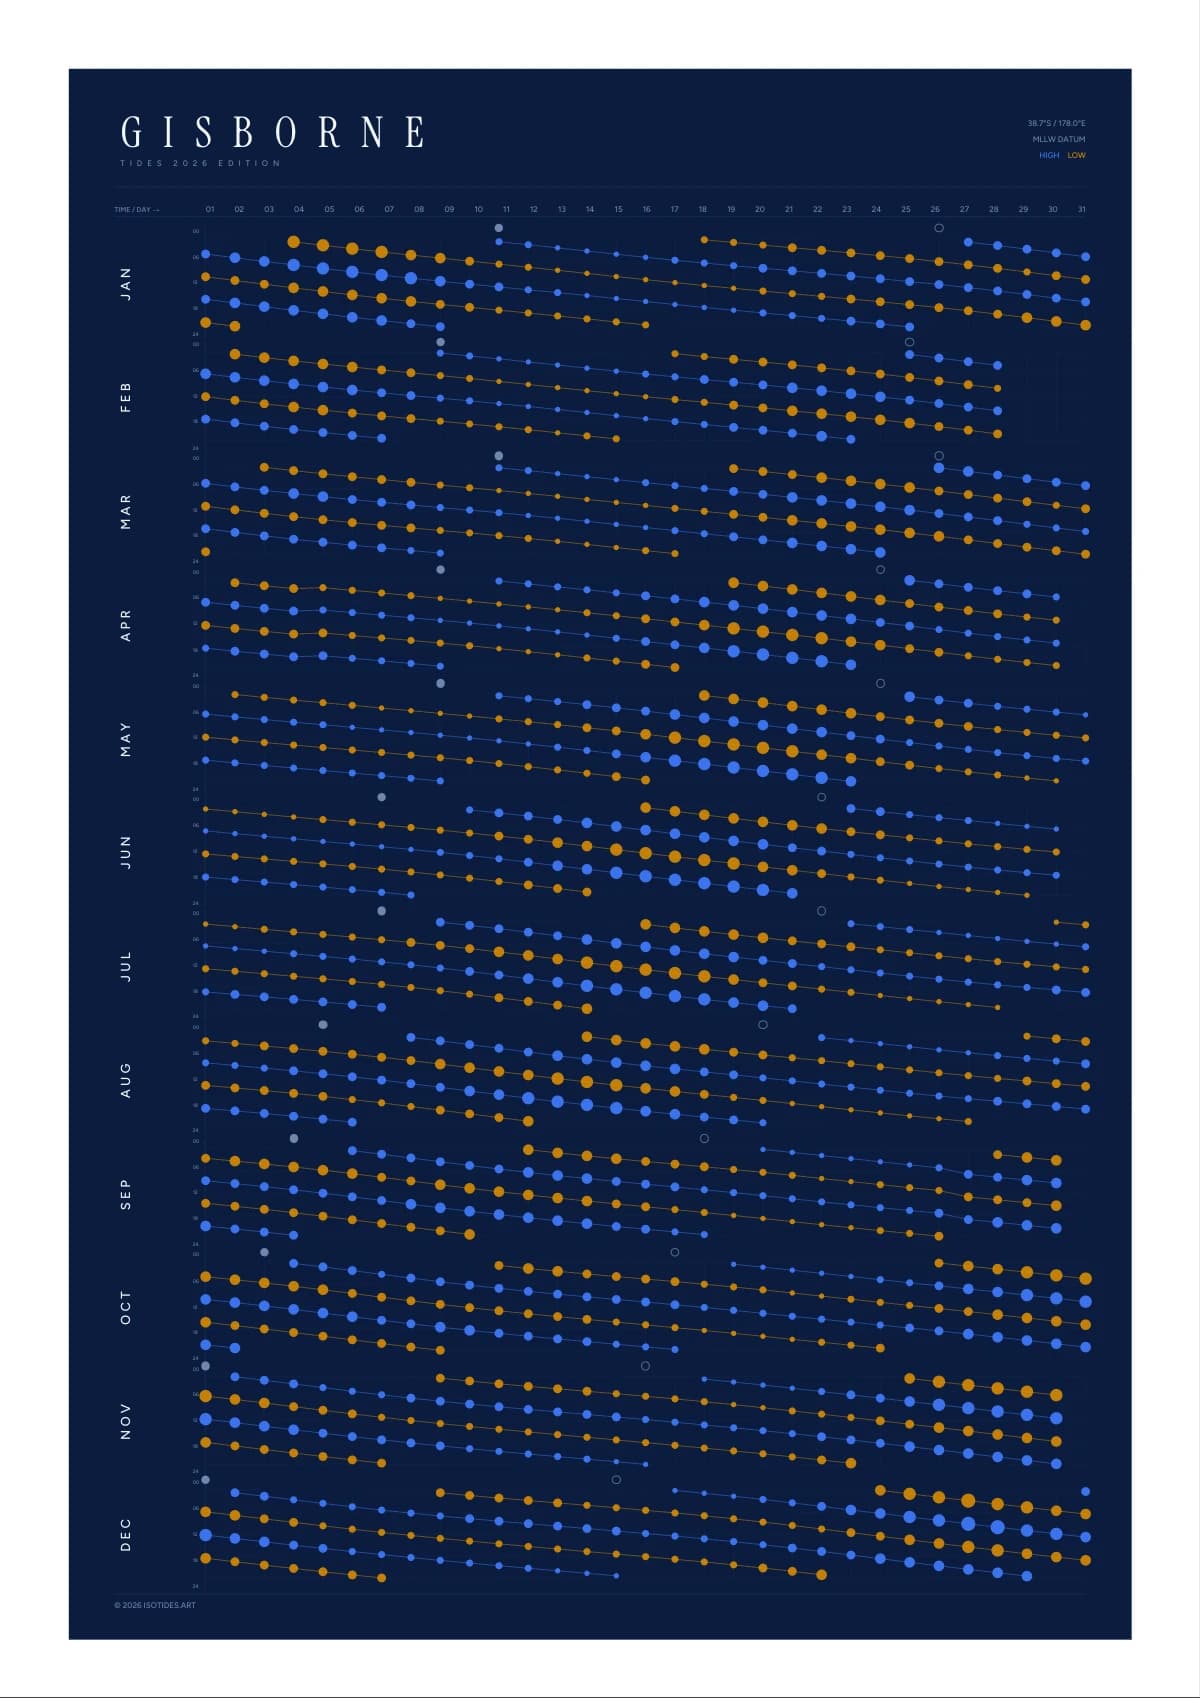
Napier's Art Deco streets meet the Pacific along a stunning stretch of coastline that blends urban elegance with natural beauty. The tides here are shaped by the vast curve of Hawke Bay, creating gentle, predictable rhythms that have guided fishermen and sailors since the city rose from the 1931 earthquake.
39.5°S / 176.9°EData: LINZ
NZ
Total
$79NZD
Free worldwide shipping
Total$79NZD
What people are saying
“So happy with my Iso Tides print! It was the perfect meaningful gift, and it looks so good in my dad’s office. He’s stoked with it! Arrived quick and is super high quality ❤️”
 Keely
KeelyProduct details
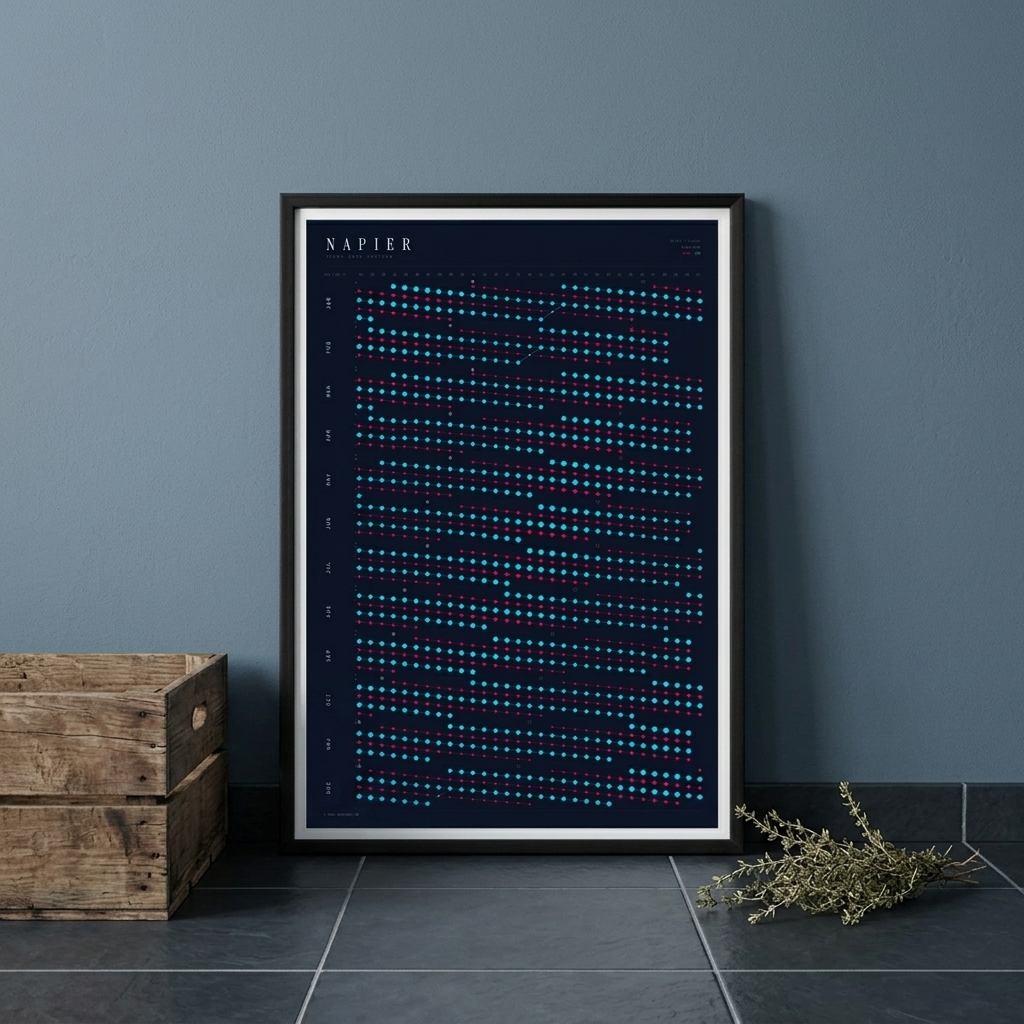
- Paper & printingEnhanced Matte paper — a luxurious flat matte surface with sharp detail and rich colour. Printed using archival pigment inks on professional Epson equipment. Each poster is individually inspected before shipping.
- FramingFrames are sustainably sourced solid wood, handmade in New Zealand, and arrive ready to hang with hardware pre-installed. Glazing protects your print. UV protection and anti-reflective coatings can be added on request.
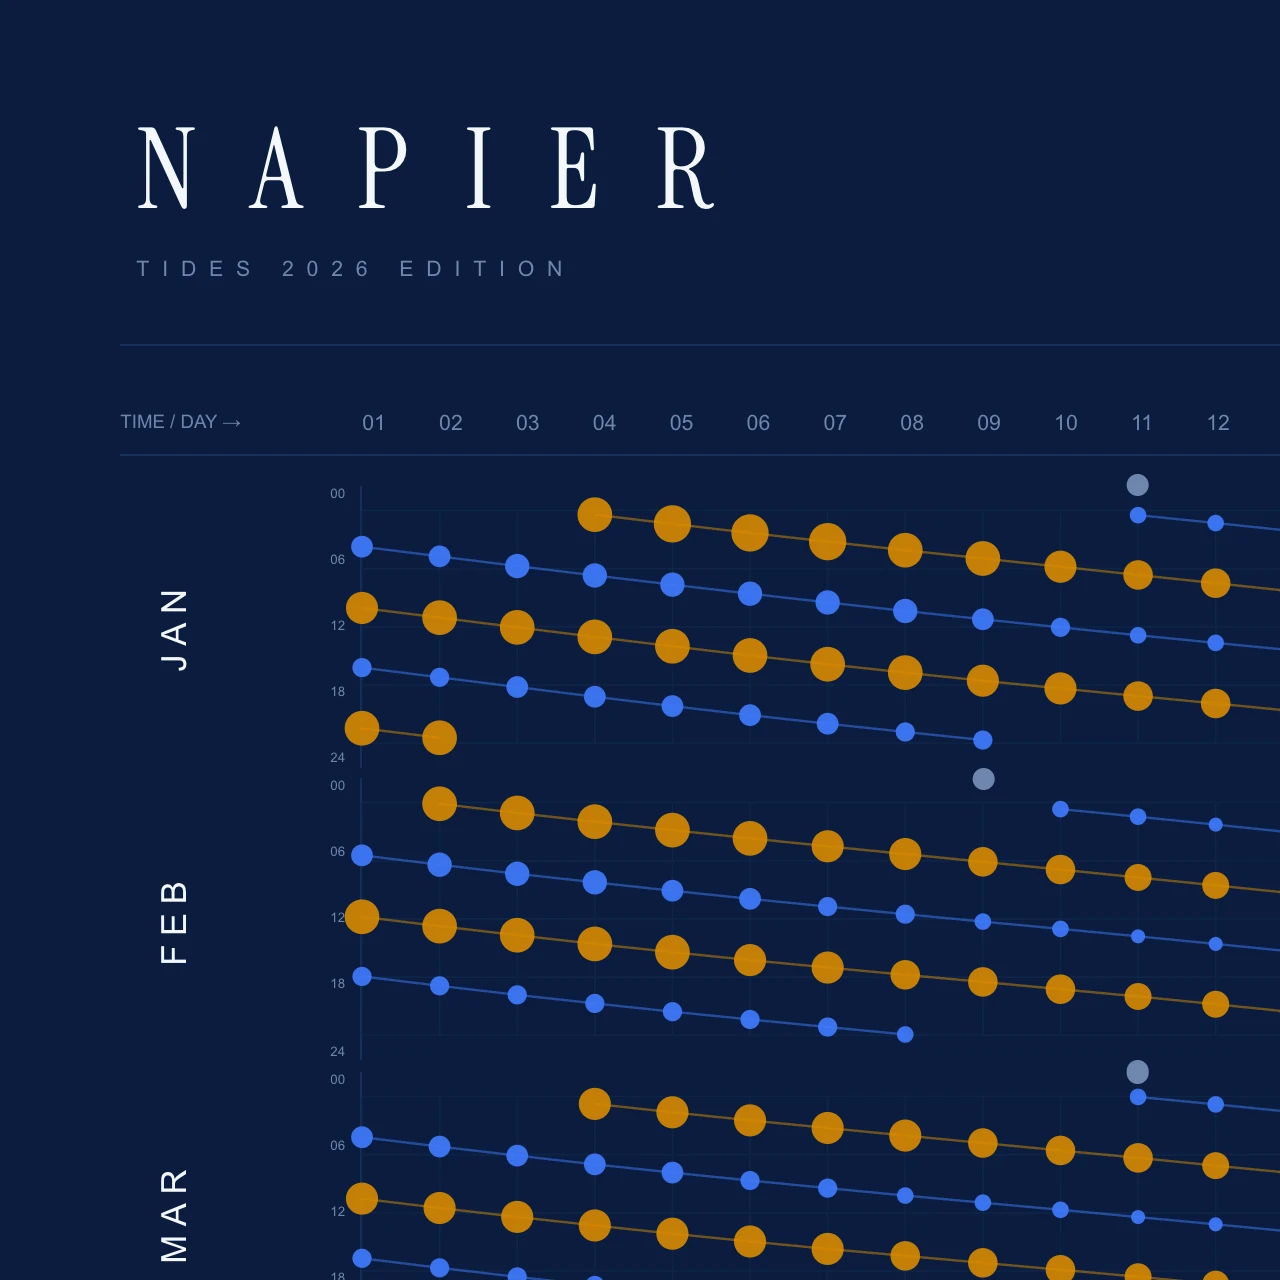
- DataPublished tide predictions from Land Information New Zealand (LINZ). The poster maps an annual high and low tide pattern. Predictions may come from a representative station; conditions at a specific beach can differ. Check the official tide source before making decisions on the water.
- EditionEach poster captures the complete tidal rhythm of your chosen beach for a full calendar year — the patterns shown will never repeat exactly the same way again.
Seasonal tide notes
How the tides and swell change through the year at Hawke's Bay locations.
Summer
Warm water with generally small swell.
Autumn
Good balance of warmth and bigger swell.
Winter
Bigger, more powerful swell, cooler temps.
Spring
Good balance of warmth and building swell.
Napier tide data
Annual tide statistics computed from published LINZ 2026 predictions for Napier. Times use the location time zone (Pacific/Auckland).
Biggest tide
2m on 19 May at 19:39
Lowest tide
0.1m on 5 Jan at 01:23
Average range
1.35m between high and low
Peak tide month
October — highest avg high tides
Tide pattern
Two high and two low tides daily
Annual range
1.9m — from lowest low to highest high
Tide times this week
High and low tide predictions for the next 7 days, from LINZ. Times use Pacific/Auckland.
| Day | High tides | Low tides |
|---|---|---|
| Sun 25 Oct | 05:08 · 1.6m, 17:31 · 1.7m | 11:21 · 0.4m, 23:48 · 0.3m |
| Mon 26 Oct | 05:58 · 1.7m, 18:22 · 1.7m | 12:11 · 0.3m |
| Tue 27 Oct | 06:48 · 1.8m, 19:13 · 1.8m | 00:37 · 0.3m, 13:03 · 0.2m |
| Wed 28 Oct | 07:39 · 1.8m, 20:06 · 1.8m | 01:28 · 0.2m, 13:55 · 0.2m |
| Thu 29 Oct | 08:31 · 1.9m, 21:01 · 1.8m | 02:19 · 0.2m, 14:50 · 0.2m |
| Fri 30 Oct | 09:25 · 1.9m, 21:56 · 1.8m | 03:12 · 0.2m, 15:45 · 0.2m |
| Sat 31 Oct | 10:20 · 1.9m, 22:52 · 1.8m | 04:05 · 0.2m, 16:42 · 0.2m |